Visually, in this period the
volatility is definitely cooling down and all the signal are valid except the first ST sell signal still in cash,
In this period we have two bottom both indicated by the red boxes (TT under -2000),After the first red box price has a steady up-leg going very easily over the pink & gold band,
from June 17 we have a slow down of the market with first test of the pink band on June 21st tentative higher stopped around the 20 hours moving average and than the start of the leg down with a test of the gold band and a counter leg up stopped by the pink band on June 23rd, some meandering under the gold band and than down till the second red box.
here the numbers for this period:
| DATE |
ST |
MT |
LT |
TT |
BALANCE ST |
BALANCE MT |
BALANCE LT |
BALANCE TT |
|
| 2010-06-04 |
17 |
-123 |
-431 |
-537 |
$13,065.10 |
$11,621.04 |
$11,123.71 |
$12,775.75 |
38% |
| 2010-06-07 |
-380 |
-551 |
-810 |
-1741 |
$13,065.10 |
$12,046.65 |
$11,531.11 |
$13,243.65 |
36% |
| 2010-06-08 |
-937 |
-935 |
-921 |
-2793 |
$13,065.10 |
$12,092.35 |
$11,574.86 |
$13,293.90 |
0% |
| 2010-06-09 |
-957 |
-916 |
-912 |
-2785 |
$13,065.10 |
$12,295.48 |
$11,769.29 |
$13,517.21 |
3% |
| 2010-06-10 |
-93 |
-234 |
-868 |
-1195 |
$13,065.10 |
$11,590.89 |
$11,094.85 |
$12,742.60 |
71% |
| 2010-06-11 |
237 |
239 |
-557 |
-81 |
$13,065.10 |
$11,368.72 |
$10,882.19 |
$12,498.36 |
79% |
| 2010-06-14 |
953 |
640 |
-215 |
1378 |
$12,587.21 |
$10,952.87 |
$10,894.34 |
$12,512.31 |
100% |
| 2010-06-15 |
952 |
926 |
-24 |
1854 |
$13,256.98 |
$11,535.68 |
$10,304.96 |
$12,898.33 |
92% |
| 2010-06-16 |
956 |
929 |
92 |
1977 |
$13,384.34 |
$11,646.50 |
$10,207.75 |
$13,022.25 |
81% |
| 2010-06-17 |
952 |
926 |
193 |
2071 |
$13,461.20 |
$11,713.38 |
$10,069.46 |
$13,097.03 |
71% |
| 2010-06-18 |
908 |
912 |
185 |
2005 |
$13,499.41 |
$11,746.63 |
$10,098.05 |
$13,134.21 |
69% |
| 2010-06-21 |
259 |
891 |
141 |
1291 |
$13,303.09 |
$11,575.80 |
$9,951.19 |
$12,943.20 |
66% |
| 2010-06-22 |
-306 |
464 |
15 |
173 |
$13,041.77 |
$11,348.42 |
$9,755.72 |
$12,688.95 |
63% |
| 2010-06-23 |
-726 |
77 |
-162 |
-811 |
$13,201.80 |
$11,268.16 |
$9,686.73 |
$12,599.22 |
68% |
| 2010-06-24 |
-951 |
-138 |
-368 |
-1457 |
$13,604.85 |
$10,916.57 |
$9,792.33 |
$12,736.58 |
69% |
| 2010-06-25 |
-946 |
-107 |
-373 |
-1426 |
$13,658.08 |
$11,109.07 |
$9,830.65 |
$12,786.41 |
70% |
| 2010-06-28 |
-827 |
-137 |
-405 |
-1369 |
$13,734.13 |
$11,170.92 |
$9,885.39 |
$12,857.61 |
57% |
| 2010-06-29 |
-759 |
-300 |
-521 |
-1580 |
$14,775.21 |
$12,017.71 |
$10,634.73 |
$13,832.25 |
37% |
| 2010-06-30 |
-935 |
-828 |
-705 |
-2468 |
$15,238.34 |
$12,394.40 |
$10,968.07 |
$14,265.82 |
18% |
| 2010-07-01 |
-944 |
-925 |
-885 |
-2754 |
$15,346.33 |
$12,482.24 |
$11,045.80 |
$14,366.92 |
4% |
| 2010-07-02 |
-956 |
-922 |
-888 |
-2766 |
$15,422.37 |
$12,544.09 |
$11,100.53 |
$14,438.11 |
4% |
Looking at ST (that concentrate on the last 5 market
days) (the first signal on June 8 is not executed since the system
volatility threshold got effected by the volatility in the market and
for that reason for the period the system sit in cash mode indicated by
the orange capital balance column),
The first ST buy signal in this period is a touch late showing but than we have a nice sell signal on June 23rd
MT (that concentrate on the last
15 days of the
market) has a concomitant buy signal with ST on June 14
this
system stay on the buy side all the way to a late sell on June 25, this one is the last sell signal this time on the down leg.
LT (that concentrate on the last 45 days of the
market) has a late buy signal with not bad sell signal concomitant with TT on June 24.
TT
(that is a system derived by the running balance of the other three
systems numbers) has a buy signal on June 15 just above the gold band and a sell signal concomitant with LT on June 24,.
Going
to the capital balance columns ST & TT are the winners so
far with a starting capital of $10000 on Feb 25 2010
the last column represent a percentile result of the correlation of the three system numbers between them compared to the same for the last three months of results
a 0% indicate that the 3 system numbers are the closest to each other in the last three month (we have an example on June 8)
a 100% indicate that the 3 system numbers are the farther to each other in the last three month (we have an example on June 14)
This triple system (with a fourth system (TT) derived by the other three systems numbers is quite valuable not only for:
- a) the various buy/sell signals generated
- b)
but also for the three daily system numbers and their position respect
to the zero line (buy/sell line) but also their position in the scale
and their position respect to +800 and above (bull area) and -800 and
below (bear area)
-c) but also the
interaction between the three system numbers between themselves and
their position in the total scale (+1000 to -1000)
-d)
but also the daily changes in the numbers from previous day(s) to gage
the speed of change in the market now also indicated by change in
percentile of the standard deviation (last column) for the last three
month readings.
we suggest to visit beginning posts to learn the
in-and-out of the system
Visually, in this period we have a fast market with volatility, already the ST system from May 11 go in cash mode all the way to June 13.
The period of first red box (TT system under -2000) May20/May24, price try to hold but get rejected by the pink band and we have the last real bottom of this period on May 25,
finally price see strength going over the pink band and testing with one day success the gold band on June 3rd,
Price goes to e higher low on June 8 (second TT under -2000 red box of the period) and from there goes and slice through both pink/gold bands.
here the numbers for this period:
| DATE |
ST |
MT |
LT |
TT |
BALANCE ST |
BALANCE MT |
BALANCE LT |
BALANCE TT |
|
| 2010-05-14 |
322 |
275 |
278 |
875 |
$13,065.10 |
$11,321.20 |
$10,836.71 |
$11,463.45 |
|
| 2010-05-17 |
83 |
100 |
83 |
266 |
$13,065.10 |
$11,321.20 |
$10,836.71 |
$11,463.45 |
|
| 2010-05-18 |
-459 |
-98 |
-144 |
-701 |
$13,065.10 |
$11,321.20 |
$10,836.71 |
$11,463.45 |
|
| 2010-05-19 |
-608 |
-227 |
-267 |
-1102 |
$13,065.10 |
$11,330.63 |
$10,845.73 |
$11,473.00 |
|
| 2010-05-20 |
-954 |
-632 |
-684 |
-2270 |
$13,065.10 |
$12,163.77 |
$11,643.21 |
$12,316.60 |
|
| 2010-05-21 |
-977 |
-833 |
-896 |
-2706 |
$13,065.10 |
$11,895.58 |
$11,386.50 |
$12,045.04 |
|
| 2010-05-24 |
-966 |
-938 |
-947 |
-2851 |
$13,065.10 |
$11,984.44 |
$11,471.56 |
$12,135.03 |
|
| 2010-05-25 |
-267 |
-665 |
-950 |
-1882 |
$13,065.10 |
$11,971.75 |
$11,459.41 |
$12,122.17 |
|
| 2010-05-26 |
-183 |
-654 |
-946 |
-1783 |
$13,065.10 |
$12,232.00 |
$11,708.53 |
$12,385.70 |
66% |
| 2010-05-27 |
153 |
-152 |
-595 |
-594 |
$13,065.10 |
$11,310.00 |
$10,825.98 |
$11,452.11 |
64% |
| 2010-05-28 |
645 |
-66 |
-384 |
195 |
$13,065.10 |
$11,419.50 |
$10,930.80 |
$11,562.98 |
90% |
| 2010-06-01 |
525 |
-122 |
-356 |
47 |
$13,065.10 |
$11,648.02 |
$11,149.53 |
$11,496.78 |
78% |
| 2010-06-02 |
302 |
-182 |
-435 |
-315 |
$13,065.10 |
$11,088.78 |
$10,614.23 |
$12,060.67 |
64% |
| 2010-06-03 |
343 |
-128 |
-374 |
-159 |
$13,065.10 |
$10,892.64 |
$10,426.48 |
$11,974.97 |
62% |
| 2010-06-04 |
17 |
-123 |
-431 |
-537 |
$13,065.10 |
$11,621.04 |
$11,123.71 |
$12,775.75 |
38% |
| 2010-06-07 |
-380 |
-551 |
-810 |
-1741 |
$13,065.10 |
$12,046.65 |
$11,531.11 |
$13,243.65 |
36% |
| 2010-06-08 |
-937 |
-935 |
-921 |
-2793 |
$13,065.10 |
$12,092.35 |
$11,574.86 |
$13,293.90 |
0% |
| 2010-06-09 |
-957 |
-916 |
-912 |
-2785 |
$13,065.10 |
$12,295.48 |
$11,769.29 |
$13,517.21 |
3% |
| 2010-06-10 |
-93 |
-234 |
-868 |
-1195 |
$13,065.10 |
$11,590.89 |
$11,094.85 |
$12,742.60 |
71% |
| 2010-06-11 |
237 |
239 |
-557 |
-81 |
$13,065.10 |
$11,368.72 |
$10,882.19 |
$12,498.36 |
79% |
| 2010-06-14 |
953 |
640 |
-215 |
1378 |
$12,587.21 |
$10,952.87 |
$10,894.34 |
$12,512.31 |
100% |
Looking at ST (that concentrate on the last 5 market
days) (all the signals till June 11 are not executed since the system volatility threshold got effected by the volatility in the market and for that reason for the period the system sit in cash mode indicated by the orange capital balance column),
All the three ST signal in this period are late showing that this system is to slow for this fast market, still we have a fast reaction from -93 reading on June 10 to +953 on June 14 in three days
MT (that concentrate on the last
15 days of the
market) has a sell signal with all the other system indicating a really negative market on May 19,
this system stay on the sell side all the way to a combined buy with ST on May 14, practically buying at the same price level as the previous sell signal, market clearly to fast for the system
LT (that concentrate on the last 45 days of the
market) has a sell signal with all the other system indicating a really negative market on May 19, no other signal from this system in this period.
TT
(that is a system derived by the running balance of the other three
systems numbers) has a sell signal with all the other system indicating a really negative market on May 19,
has a late buy signal at the beginning of June and
a good sell signal June 3rd,
no other signal till the end of this period.
Going to the capital balance columns ST & TT are the closer winner so far with a starting capital of $10000 on Feb 25 2010
For this period we have a new column added (last column)
each day we get the standard deviation number between the ST, MT & LT numbers and compare that number to the last 3 month of numbers and see on a percentile basis where today number is respect to the last three month of numbers,
for example on June 8 we have a 0% reading that means on the days the standard deviation number between the tree systems numbers
was the lowest (numbers very close to each other)
On the contrary
on June 14 the number give a last column percentile of 100% since the number are the farther from each other showing how in a few days we go from one extreme to the other indicating a fast changing market.
This triple system (with a fourth system (TT) derived by the other three systems numbers is quite valuable not only for:
- a) the various buy/sell signals generated
- b)
but also for the three daily system numbers and their position respect
to the zero line (buy/sell line) but also their position in the scale
and their position respect to +800 and above (bull area) and -800 and
below (bear area)
-c) but also the
interaction between the three system numbers between themselves and
their position in the total scale (+1000 to -1000)
-d) but also the daily changes in the numbers from previous day(s) to gage the speed of change in the market now also indicated by change in percentile of the standard deviation (last column) for the last three month readings.
we suggest to visit beginning posts to learn the
in-and-out of the system
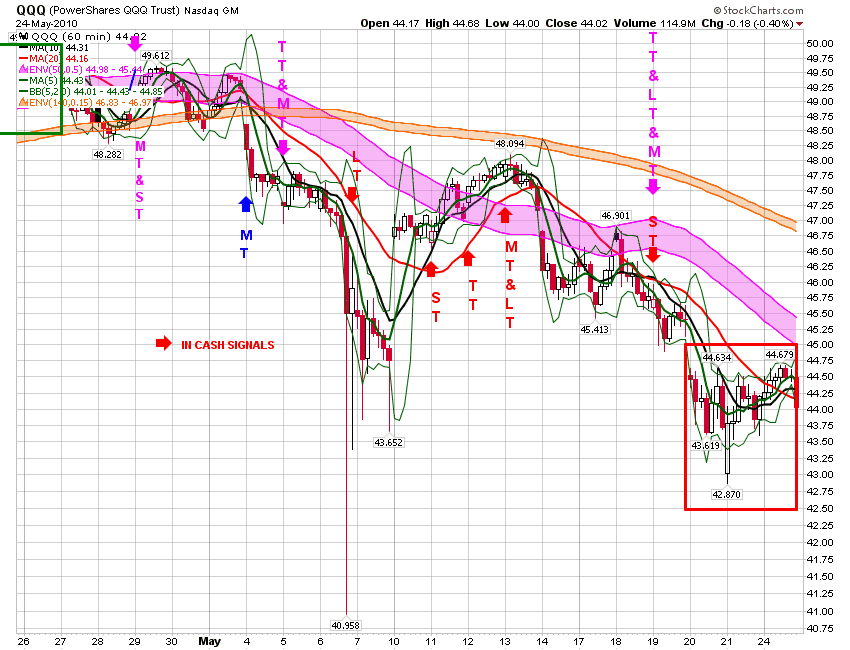
Visually, The "spaghetti top" (see previous post) was confirmed by a down draft in the market.
The pink band cross under the gold band a clear visual of a tanking market.
here the numbers for this period:
| DATE |
ST |
MT |
LT |
TT |
BALANCE ST |
BALANCE MT |
BALANCE LT |
BALANCE TT |
| 2010-04-26 |
916 |
865 |
903 |
2684 |
$12,726.93 |
$12,724.84 |
$12,724.84 |
$12,724.84 |
| 2010-04-27 |
81 |
386 |
876 |
1343 |
$12,203.61 |
$12,201.60 |
$12,201.60 |
$12,201.60 |
| 2010-04-28 |
-204 |
-54 |
793 |
535 |
$12,213.94 |
$12,211.93 |
$12,211.93 |
$12,211.93 |
| 2010-04-29 |
-230 |
-109 |
665 |
326 |
$12,036.21 |
$12,034.23 |
$12,623.33 |
$12,623.33 |
| 2010-04-30 |
-271 |
-59 |
632 |
302 |
$12,518.11 |
$12,516.05 |
$12,146.04 |
$12,146.04 |
| 2010-05-03 |
-79 |
122 |
717 |
760 |
$12,147.57 |
$12,145.57 |
$12,471.95 |
$12,471.95 |
| 2010-05-04 |
-434 |
-356 |
277 |
-513 |
$12,892.58 |
$12,011.95 |
$11,718.61 |
$11,718.61 |
| 2010-05-05 |
-351 |
-487 |
18 |
-820 |
$13,002.37 |
$11,665.97 |
$11,604.63 |
$11,381.08 |
| 2010-05-06 |
-519 |
-720 |
-325 |
-1564 |
$13,850.89 |
$12,427.29 |
$10,836.71 |
$12,123.80 |
| 2010-05-07 |
-395 |
-633 |
-415 |
-1443 |
$14,508.07 |
$13,016.92 |
$10,836.71 |
$12,699.03 |
| 2010-05-10 |
17 |
-152 |
-158 |
-293 |
$13,065.10 |
$11,722.26 |
$10,836.71 |
$11,435.99 |
| 2010-05-11 |
126 |
-48 |
-48 |
30 |
$13,065.10 |
$11,750.41 |
$10,836.71 |
$11,463.45 |
| 2010-05-12 |
953 |
222 |
262 |
1437 |
$13,065.10 |
$11,321.20 |
$10,836.71 |
$11,463.45 |
| 2010-05-13 |
953 |
312 |
343 |
1608 |
$13,065.10 |
$11,321.20 |
$10,836.71 |
$11,463.45 |
| 2010-05-14 |
322 |
275 |
278 |
875 |
$13,065.10 |
$11,321.20 |
$10,836.71 |
$11,463.45 |
| 2010-05-17 |
83 |
100 |
83 |
266 |
$13,065.10 |
$11,321.20 |
$10,836.71 |
$11,463.45 |
| 2010-05-18 |
-459 |
-98 |
-144 |
-701 |
$13,065.10 |
$11,321.20 |
$10,836.71 |
$11,463.45 |
| 2010-05-19 |
-608 |
-227 |
-267 |
-1102 |
$13,065.10 |
$11,330.63 |
$10,845.73 |
$11,473.00 |
| 2010-05-20 |
-954 |
-632 |
-684 |
-2270 |
$13,065.10 |
$12,163.77 |
$11,643.21 |
$12,316.60 |
| 2010-05-21 |
-977 |
-833 |
-896 |
-2706 |
$13,065.10 |
$11,895.58 |
$11,386.50 |
$12,045.04 |
| 2010-05-24 |
-966 |
-938 |
-947 |
-2851 |
$13,065.10 |
$11,984.44 |
$11,471.56 |
$12,135.03 |
Looking at ST (that concentrate on the last 5 market
days), on April 28 after a very strong change of numbers between
April 26 & 27, we have a valid sell signal,
the next buy signal on May 15 and sell signal on May 19 the ST signal volatility threshold kick in and this system for the the all period goes in cash indicated by the orange background on the column of the "Balance ST" (note: every day we calculate the market volatility number, and on a signal day, if the volatility number is higher than that particular system threshold number, that system extract itself from the market going in cash mode indicated in the balance column by the orange background)
MT (that concentrate on the last 15 days of the
market) has a sell signal on April 29, on the same day as the ST (usually same day signal or next day signal on ST & MT are very strong signals)
On May 12 signal, this system goes in cash and re-enter the market on the down signal on May 19.
On the positive days from May 12 to May 17 this system numbers remain very close to the zero line (the highest been 312)
LT (that concentrate on the last 45 days of the
market) is always late to the party, but is a very important
indicator, in the sense that if LT get involved means that really
things are really chaged in the market and is not a temporary
set-back.
Also, in this period, the sell signal on May 07 is very late, and is a going in cash mode signal, and the same for May 13 another in cash signal.
This system re-enter in the market on May 19 on a sell signal.
TT (that is a system derived by the running balance of the other three systems numbers) has same important sell signals as MT for this period and has also a in cash period in between,
TT also give the red box indicated in the chart above when the number get lower than -2000
As stated before the last four column represent the
running total of the four indicators results with a starting capital
of $10000 on Feb 25, 2010,
This triple system (with a fourth system (TT) derived by the other three systems numbers is quite valuable not only for:
a) the various buy/sell signals generated
b) but also for the three daily system numbers and their position respect to the zero line (buy/sell line) but also their position in the scale and their position respect to +800 and above (bull area) and -800 and below (bear area)
c) but also the interaction between the three system numbers between themselves and their position in the total scale (+1000 to -1000)
d) but also the daily changes in the numbers from previous day(s) to gage the speed of change in the market
we suggest to visit beginning posts to learn the
in-and-out of the system
Visually, we have what I call a "spaghetti top"
indicated by the price meandering over the pink band and under the
pink band several times showing a tug of war between buyers and
sellers.
Please notice also how the price first goes only
under the pink band and not involving the gold band in the action,
than we have more price deterioration going under the gold band and
loosing momentum not reaching previous top.
Clearly just visually investors had ample time to
take action for this clear top
here the numbers for this period:
| DATE |
ST |
MT |
LT |
TT |
BALANCE ST |
BALANCE MT |
BALANCE LT |
BALANCE TT |
| 2010-04-05 |
454 |
607 |
929 |
1990 |
$11,852.35 |
$11,850.40 |
$11,850.40 |
$11,850.40 |
| 2010-04-06 |
912 |
866 |
926 |
2704 |
$11,918.25 |
$11,916.30 |
$11,916.30 |
$11,916.30 |
| 2010-04-07 |
895 |
865 |
930 |
2690 |
$11,873.72 |
$11,871.77 |
$11,871.77 |
$11,871.77 |
| 2010-04-08 |
493 |
782 |
926 |
2201 |
$11,907.57 |
$11,905.61 |
$11,905.61 |
$11,905.61 |
| 2010-04-09 |
464 |
724 |
926 |
2114 |
$12,055.41 |
$12,053.43 |
$12,053.43 |
$12,053.43 |
| 2010-04-12 |
525 |
851 |
929 |
2305 |
$12,073.22 |
$12,071.24 |
$12,071.24 |
$12,071.24 |
| 2010-04-13 |
573 |
887 |
932 |
2392 |
$12,197.91 |
$12,195.90 |
$12,195.90 |
$12,195.90 |
| 2010-04-14 |
815 |
882 |
933 |
2630 |
$12,491.81 |
$12,489.76 |
$12,489.76 |
$12,489.76 |
| 2010-04-15 |
869 |
892 |
936 |
2697 |
$12,600.47 |
$12,598.40 |
$12,598.40 |
$12,598.40 |
| 2010-04-16 |
477 |
880 |
922 |
2279 |
$12,303.00 |
$12,300.98 |
$12,300.98 |
$12,300.98 |
| 2010-04-19 |
80 |
446 |
913 |
1439 |
$12,281.62 |
$12,279.61 |
$12,279.61 |
$12,279.61 |
| 2010-04-20 |
80 |
372 |
909 |
1361 |
$12,409.87 |
$12,407.84 |
$12,407.84 |
$12,407.84 |
| 2010-04-21 |
239 |
566 |
913 |
1718 |
$12,548.81 |
$12,546.75 |
$12,546.75 |
$12,546.75 |
| 2010-04-22 |
642 |
825 |
912 |
2379 |
$12,680.62 |
$12,678.54 |
$12,678.54 |
$12,678.54 |
| 2010-04-23 |
929 |
878 |
904 |
2711 |
$12,789.28 |
$12,787.18 |
$12,787.18 |
$12,787.18 |
| 2010-04-26 |
916 |
865 |
903 |
2684 |
$12,726.93 |
$12,724.84 |
$12,724.84 |
$12,724.84 |
| 2010-04-27 |
81 |
386 |
876 |
1343 |
$12,203.61 |
$12,201.60 |
$12,201.60 |
$12,201.60 |
| 2010-04-28 |
-204 |
-54 |
793 |
535 |
$12,213.94 |
$12,211.93 |
$12,211.93 |
$12,211.93 |
| 2010-04-29 |
-230 |
-109 |
665 |
326 |
$12,036.21 |
$12,034.23 |
$12,623.33 |
$12,623.33 |
| 2010-04-30 |
-271 |
-59 |
632 |
302 |
$12,518.11 |
$12,516.05 |
$12,146.04 |
$12,146.04 |
| 2010-05-03 |
-79 |
122 |
717 |
760 |
$12,147.57 |
$12,145.57 |
$12,471.95 |
$12,471.95 |
| 2010-05-04 |
-434 |
-356 |
277 |
-513 |
$12,892.58 |
$12,011.95 |
$11,718.61 |
$11,718.61 |
first weakness: Looking at ST (that concentrate on the last 5 market days), already on April 19 deteriorate to double digit positive for a couple of days and
MT (that concentrate on the last 15 days of the market) show some weaknessfor the same couple of days.
After that we have the last move up in the market confirmed by three days of green box (TT above +2000) and the three indicators above bull line of +800 and extreme bull line of +900.
April 27 indicators numbers was a big clue, just in one day ST went from 916 to only 81, big red flag there, next day April 28 ST/MT double indicator signal change on the same day, very bearish
LT (that concentrate on the last 45 days of the market) is always late to the party, but is a very important indicator, in the sense that if LT get involved means that really things are really chaged in the market and is not a temporary set-back.
As stated before the last four column represent the running total of the four indicators results with a starting capital of $10000 on Feb 25, 2010,
This triple system (with a fourth system (TT) derived by the other three systems numbers is quite valuable not only for:
a) the various buy/sell signals generated
b)
but also for the three daily system numbers and their position respect
to the zero line (buy/sell line) but also their position in the scale
and their position respect to +800 and above (bull area) and -800 and
below (bear area)
c) but also the
interaction between the three system numbers between themselves and
their position in the total scale (+1000 to -1000)
d) but also the daily changes in the numbers from previous day(s) to gage the speed of change in the market
we suggest to visit beginning posts to learn the in-and-out of the system